I’ve been recently playing with Splunk and I wanted to share the experience I am having so that you too can play with this cool tool.
What is Splunk?
I think the chaps from Splunk explain that the best…
Splunk is the engine for machine data. Use Splunk to collect, index and harness the fast moving machine data generated by all your applications, servers and devices — physical, virtual and in the cloud. Search and analyze all your real-time and historical data from one place.
Splunking your machine data lets you troubleshoot problems and investigate security incidents in minutes, not hours or days. Monitor your end-to-end infrastructure to avoid service degradation or outages. Meet compliance mandates at lower cost. Correlate and analyze complex events spanning multiple systems. Gain new levels of operational visibility and intelligence for IT and the Business.
Cool… but then why is this nice?
Traditional support organizations supporting large web farms often have monitoring in place and then when something goes wrong they go to the server and search the logs until they have the reason for the failure. At the bare minimum, which is where I am at, Splunk aggregates all the logs from your entire web farm and presents is as one complete picture. From this I can see trends and machines with difficulties (problematic to spot when you have alot of servers). I am sure Splunk does a lot more, but I am not yet there. When I have discovered them, I will share them but so far I am a happy camper.
Adding SDL Tridion (of course) as a data source
Splunk takes multiple sources of log data and the usual list of candidates are web server (in my case, IIS) logs and Windows Event Logs. I want my Content Delivery logs integrated and so I set about doing this.
For this I will leverage SDL Tridion 2011’s updated logging (LOGBack) and with this I am able to configure logging to output logs to Syslog. Syslog is a standard way of logging application messages that separates the software application and the system logging the messages. In essence, the messages can be pushed out much like a network broadcast and a logging system, Splunk, captures that.
SO I want to configure the logging in SDL Tridion Content Delivery to push the messages to Syslog. For this we need two things: 1) an Appender and 2) a reference to that appender for my log. The Appender configures my log output and looks like:
<appender name="SYSLOG">
     <syslogHost>localhost</syslogHost>
     <facility>LOCAL0</facility>
     <suffixPattern>[%thread] %-5level %logger %msg</suffixPattern>
</appender>
This is the example from the LOGBack help documentation (http://logback.qos.ch/manual/appenders.html) with the addition of the logging level (“%-5level” which captures “ERROR”, “INFO” etc.). Then I can set a given log to push it’s messages to my Syslog appender:
<logger name="com.tridion.deployer">
     <appender-ref ref="rollingDeployerLog"/>
     <appender-ref ref="SYSLOG"/>
</logger>
I’ve kept in the original logging (“rollingDeployerLog”) just for testing and validation.
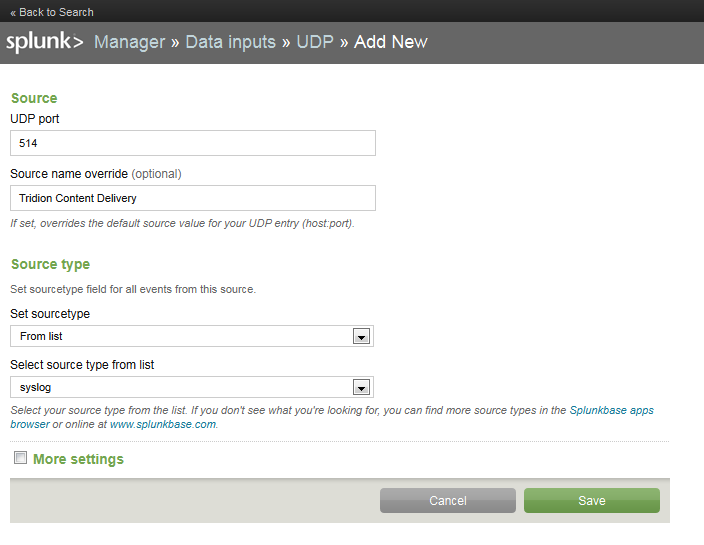
 In Splunk I need to add a data source to listen to this output. So I add a new local Syslog data source specifying the (standard) port. I don’t need to specify a hostname because I did that in my logging configuration on Tridion. I told it to push the messages to “localhost” but that could be any server.
After that, once Tridion logs messages, Splunk will pick them up and store them.
Show the really cool graphs!
I had the chance to demo Splunk as a possible purchase for the IT department for mid-sized health and wellness company. Really cool and useful tech IMO. Spunk was branding itself as “logs” + “Google” last I checked.
Very cool indeed. I see Splunk popping-up more and more!
How does this relate to the Tridion Monitoring Service? Does Splunk make this service superfluous?
No, Splunk primarily collects and aggregates logging and event information to help you managing large farms of servers (the way i look at it). As far as I can see, it will not trigger things like SNMP traps (although it is possible to script that). So you will still need Tridion’s Monitoring to fire SNMP traps when things go wrong.